Infographics: learning to live with imperfection
February 24 2014 5:02 PM
To start with, I was with them. I was one of the angry ones. How could people do it? Why would they do it?
Then I learned to live with imperfect infographics.
You see, when infographics first started to proliferate on social media (and personally, I credit David McCandless with starting the movement via his wonderful book, Information is Beautiful) they were a revelation. They showed how a bit of clever design made information MORE digestible. Not prettier. They actually made the process of taking info on board easier. Now that was real design. And in the time-poor, 100mph, blink-and-you-miss-it culture of social media that was a Very Good Thing Indeed.
But then we marketers got involved. And over the next few years anything with an image or two passed for an infographic.
Heresy.
Did we not realise what we were doing? How dare we pass it off as an infographic when all we had done was include a few graphs in something that would otherwise be called, well, text...?
But because social media years are like dog years (you're a seasoned campaigner if you were tweeting before 2010) I have had time to come to terms with this outrage. I have mellowed with age.
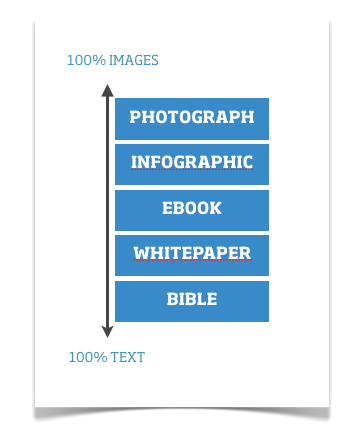
It really doesn't matter what things are called. The balance of images versus text doesn't really matter either. What matters is whether they communicate clearly or not.
But if you must use a label, perhaps the guide below to the sliding scale of infographic-ness will help. I call it an mini-infographic. I think it might catch on...
Sites we love
- Casinos Not On Gamstop
- Non Gamstop Casinos
- Casinos Not On Gamstop
- UK Betting Sites
- Casino Sites Not On Gamstop
- Best Non Gamstop Casinos UK 2025
- Non Gamstop Casino UK
- Best Non Gamstop Casinos
- Non Gamstop Casinos UK
- Non Gamstop Casinos
- Casino Sites Not Blocked By Gamstop
- Non Gamstop Casinos UK
- Casino Not On Gamstop
- Non Gamstop Casinos
- Slot Sites UK
- Non Gamstop Casino Sites UK
- Casino Sites UK Not On Gamstop
- UK Casinos Not On Gamstop
- Non Gamstop Casino
- UK Online Casinos Not On Gamstop
- New Non Gamstop Casinos Uk
- UK Casino Not On Gamstop
No Comments