Recently in Analytics Category


I quickly found out that Google recently released a very exciting new feature in Webmaster Tool that enables us to see the number of impressions and clicks for our most popular keywords, together with the rankings of keywords for a defined period. This was interesting, since it was now possible to analyse how the number of impressions and clicks differed based on the different positions of a website in Google search results. In fact, this new Webmaster Tool feature is quite close to the Click-Through-Rate data provided in Google Adwords.
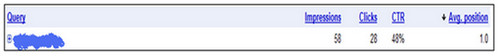
Ranking Report in Google Webmaster Tool
I was delighted to find such detailed and useful information. However, I quickly realised that what Google might be indirectly telling us is quite exceptional and could drastically change the way the 'search industry' reports on results.
The most interesting thing I discovered is the fact that Google is now showing data on rankings across a range of results: detailed information from position 1 to position 5, and combined data for position 6-10 and then combined data for the 2nd page and 3rd page on the Search Engine Results (SERPs). With the recent advent of Google Personalised Search, rankings are no longer the same for every visitor and never before had there been a good way of tracking the impact of this.
Personalised search is, in reality,
customised search results for users based on their previous search activity. This being possible by an anonymous cookie in
their browsers and which Google says is completely separated from Google
Accounts. But with this new Google webmaster tool feature, we are now capable
of analysing the rankings of websites on both personalised results and general
organic results.
What Google is trying to make us understand here is that a website will no longer have a particular ranking for a specific keyword, but will have a range of rankings determined by various personalisation factors.
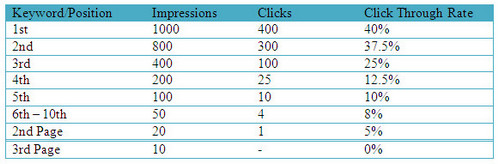
So, I believe search experts will now have to analyse, optimise and report on website rankings differently. Whilst in the past an agency or in-house Search Specialist might have reported on exact website rankings based on targeted keywords, reports would make more sense if they now provide the complete range of ranking positions that a website has for a keyword together with its related traffic. Below is an example on how a section of a search report might look:
No Comments
If you are from a B2B context you might schedule your ads to run only on business hours - let's assume only weekdays say from 8:00 am to 6:00 pm. targeting business hours when you think your audience is looking for your products/services. Setting up the ad scheduling is easy as ABC - or B2B! Simply log in to your AdWords account, go to the settings tab, then advanced settings and there you find the ad scheduling settings.
But how can you be certain your scheduled ads actually target your audience effectively, that you are spending your cost per click on your desired audience? This is very your Google Analytics account come into play. Google Analytics Custom Reporting can help you take out the guesswork in ad scheduling when your audience is looking for your products/services. Let your website visitors, who are your audience determine when to target your PPC audience.
By setting up a custom report you can find out how visitors are behaving on your website at what hours of the day, at what days, pages per visit and bounce rate. With this information you can adjust the PPC ad scheduling and budget accordingly.
To set up custom reporting simply login to your Analytics account, click on custom reporting in the left menu and in the top right corner click on "create a new custom report". Nothing needs to be installed or verified.
In the left menu called 'Metrics' click on 'Site Usage' and drag-and-drop 'Entrances' (along with good traffic quality indicators 'Time on Site', 'Pages per Visit', and 'Bounce Rate') one by one across to the 'Metric' boxes. Then do the same thing with 'Dimensions', click on 'Visitors' and drag-and-drop 'Day' over to the 'Dimension' box and 'Hour of the Day' over to the 'Sub-Dimension' box.
Then rename your custom report to whatever you want to call it by editing the title. Click the 'Preview' button to see your custom report and if you are happy with the report then finally click on 'Create Report'. Now you have created your custom report!
With these metrics in your custom report you can now in more detail find out how visitors behave on your website, during what hours of the day and at what days. Based on the information you get from the report you might want to refine the PPC ad scheduling.
In the example above the majority of entrances to the website happened in late afternoons between 2:00 pm and 5:00 pm and the majority of entrances happened on Mondays and Fridays. From this example scheduling the PPC ads to run only on 8:00 am to 6:00 pm on only weekdays would be advisable.
Set aside a couple of hours to learn Google Analytics custom reporting. Apart from creating a custom report in Google Analytics to refine PPC spend and strategy you can create a custom report to help you optimise your online leads and conversions. More about that in another blog post.
I was mostly concerned about tools on tracking twitter traffic. For sure, there are a lot of 'cool' tools out there allowing us to track number of hits, geolocalisation and even do real-time traffic analysis but it was not always convenient to have data separated from my main web analytics software. My approach to web analytics is to have a consistent, reliable and integrated view of the traffic thus ensuring a clear vision on what is going on in my campaigns. Furthermore, after testing several twitter analytics applications I didn't find the statistics from the different tools meaningful enough. So I revert back tracking my tweets on Google Analytics (GA). It is much more powerful in my opinion when considering all the functions that we have on GA. It would be wiser to use them to track our twitter campaigns. For example, we can track and analyse goals and conversion rates knowing very well how conversion rate analysis is imperative today.
Google analytics by default shows traffic coming from twitter but wait.. it shows traffic coming from Twitter.com only and today most of the people using Twitter never even visit twitter.com! For that reason, I prefer to manually add some utm codes on my URLs and this allows me to track my tweets wherever they are, even if someone forward my tweets by email.
As you know, tweets that include a URL use some type of URL shortening service, like http://bit.ly or http://cli.gs, but we will be using the classic Tinyurl.com which shortens a URL by creating a redirect that is hosted on www.tinyurl.com. The trick is to add GA's campaign tracking parameters to our Tiny URL, thus encoding campaign info into the URL we use in our tweets:
?utm_campaign=blogpost&utm_source=twitter&utm_medium=micro-blog
Of course you can change the utm_campaign and utm_medium names to anything you like but be sure they makes sense since you will be using them in your analyses later.
Example:
http://www.itjoblog.co.uk/?utm_campaign=itjoblogpost&utm_source=twitter&utm_medium=micro-blog
After adding this code to the URL, we shorten it using TinyURL and finally use the 'shortened' URL in our tweets which will be traceable by GA.
Below is a picture on how the data appear in 'All Traffic Sources' report in GA:
This is very cool, but it's even nicer to use all the power of Google Analytics in your web analyses, for example you could use Advanced Segments feature to subdivide your visitors based on operating systems they used to reach your tweets (Windows, Mac, Iphone, etc). Or if you like you could create your own segment that makes sense to your campaign.
As said by Gail Ennis, senior vice-president of marketing at Omniture: "Online marketers recognise the importance of brand reputation management in the social media environment," and I believe that accurate twitter tracking is fundamental and can help a lot in social media campaign analysis.
So why is visitor segmentation so important?
It is simply the breaking of your site visitors into groups and examining traffic and conversion data for those specific groups. Actually, in Google Analytics, you can perform advanced visitor segmentation and see the number of visits, the average number of pages viewed per visit, and conversion rates for different groups of visitors (example analysis of visitors from different locations).
Google Analytics provides a number of default segments like New, Returning, Paid and Non-Paid Visitors, Search, Direct and Referral Traffic. But you can also create your own custom segments. For example you could find yourself segmenting branded search vs non-branded search terms for organic and paid traffic. Why segmenting all these? Because looking at 'all' your figures that in average does not mean a lot. Figures like 'Average Time on Site' does not mean a lot since it is too broad. To find the real actionable insights we need to break our analytics data and split the various sources, behaviour, goals and outcomes. In brief we need to focus on the details as far as possible. Because trying to make strategic decision based on global data can simply lead our business to failure.
Ok, let's now really ask why we should segment our visitors and customers and think about the 'real' reasons for these.
In today's, highly competitive world successful companies realise that the nurturing of high-value, faithful, recurring, pleased and lucrative customers is the key solution for having long lasting profits and help the business stay afloat. In fact, I totally believe that it is imperative for organisations to properly identify their customers. No company can afford to offer the premier level of service to all its customers without really knowing who they are.
Therefore calculating the visitors' and customers' value to the company enable us to know better the different types of customers we have and therefore put us in a better position to allocate valuable resources to different types of visitors/customers. After discovery of those different customer classes we can approach different type of customers differently, like proposing appropriate products at appropriate prices for a particular segment.
For exemple: Advanced segmentation could let you see what are the web pages that are most visited by visitors who came on your site by typing brand keywords. And also what are the products that they bought?
Another common term 'Customer Differentiation' is in fact the segmentation of the high-value and high-potential customers but also the identification and separation of the least cost-effective customers. This process is important to know who the company want to serve, it involves the effort to understand what the customer really wants, what are the customers worth or potential. After discovering valuable information about customers we are is in a better position to give priority to the most profitable ones. We can also decide what to do with the least cost-effective customers.
For exemple: It is useful to discover who are the customers that purchased more than one items on your website, and/or who are the ones that purchased again. Then based on these figures we could deploy more effort to a particular 'segment' of our customers.
One way of differentiating customers is by establishing a baseline for the servicing cost of all customers. The segmentation of all customers should then be done to represent them in figures. After that we evaluate actual and strategic value of all the different types of customers (segments) and finally compare the customer value figures to the baseline established before and consequently make appropriate strategic decisions accordingly. The following graph shows an example of how customer segmentation, customer value and the servicing cost baseline can be represented for decision-making purposes.
Whereas the last group (tier 5) is well below the customer service cost baseline and has also a very low strategic value, appropriate decisions can then be made by managers concerning those customers classified under this group. For example: keep them with expectations that they can be more lucrative later or simply fire them?
As said by Brett Crosby, the Manager of Google Analytics : "Segmentation can help you perform better through an economic downturn and go with what works, find new ways to drive revenue, find the right segments, working for them and invest there to increase their conversions."
1. A rising bounce rate is bad. Bounce rate is (the number of entrances to a webpage that left the site without viewing any other pages) divided by (number of entrances). It sounds bad doesn't it? The percentage of people who found your site so bad, they didn't abandon it by walking away, they were so thrilled to get out they actually bounced off in glee.
A high bounce rate can mean that users found the landing page (optimized to rank well on SERPS) perfectly relevant to their desires and didn't need anything else on your site. They took in your perfectly relevant content and departed without taking an interest in the rest of your site.
For instance, my cousin tells me he bought a mountain board. I do not know what this is, so upon googling "mountain board" I find a relevant site to explain it. Seeing that I don't have a particular interest in sporting equipment, I bounce from the site after reading up on mountain boards. Argos-sports.co.uk probably will read my visit as a bounce, but in fact, I utilized their great definition of mountain boarding and departed.
2.Less Time on Site means Visitors are Less Interested. A decrease in the amount of time spent on site doesn't have to spell disaster - it can mean people are finding information faster. This is a common result for redesigned sites. So don't be upset if your website is doing an amazing job allocating the time available! You may simply be leading visitors to their wanted information instead of pushing them out to pasture where they must foraging for relevant content.
3. Impressions are really important. Impressions are the number of times your ad shows up in a Pay Per Click advertising campaign. We have clients who see their number of impressions decrease over two months and get worried, even as the number of clicks increase! Root of Misconception: People familiarize themselves with your company/website by grazing past your impression to click on another source. Correct: Users who click on your website are learning about your company/product/service.
So don't worry about impressions, if anything, worry about clicks and the Click Through Rate (CTR), which is the number of clicks divided by the number of impressions. These numbers reflect how many users are becoming familiar with your website.
...So what statistics have you found most helpful when judging your website/s? Any other common misconceptions you can ad to the list from personal experiences?